Generating a General Report
1. Click on the Reporting => Reports section and choose "General Report".

2. Click the "Generate Report" button and choose the period in Settings Window.

3. Click "Generate Report" and wait till the report is generated.

4. Then click the three-dots menu button and click "Download Report".

5. The General Report will be downloaded in the CSV format on your device.
The General Report consists of the following columns:
User Email; User Full name; User Departments; User Groups; Training; Campaign Name; Training Campaign Start Date; Training Campaign End Date; Training Status; Assignment Type; Assigned by; User Progress Status; User Progress Percentage; User Assignment Date; User Start Date; User Completion Date
Reports By Task
In the Admin Console, access the Reporting tab from the left sidebar and choose Reports. The options presented are on the analytics for Assignments and Phishing summary
The Assignments section presents below items:
Training Progress
The training progress tab presents the analytics for training campaigns that were run on the account.
You can filter those events either by choosing the desired campaign, department, and status (status buttons are also clickable)
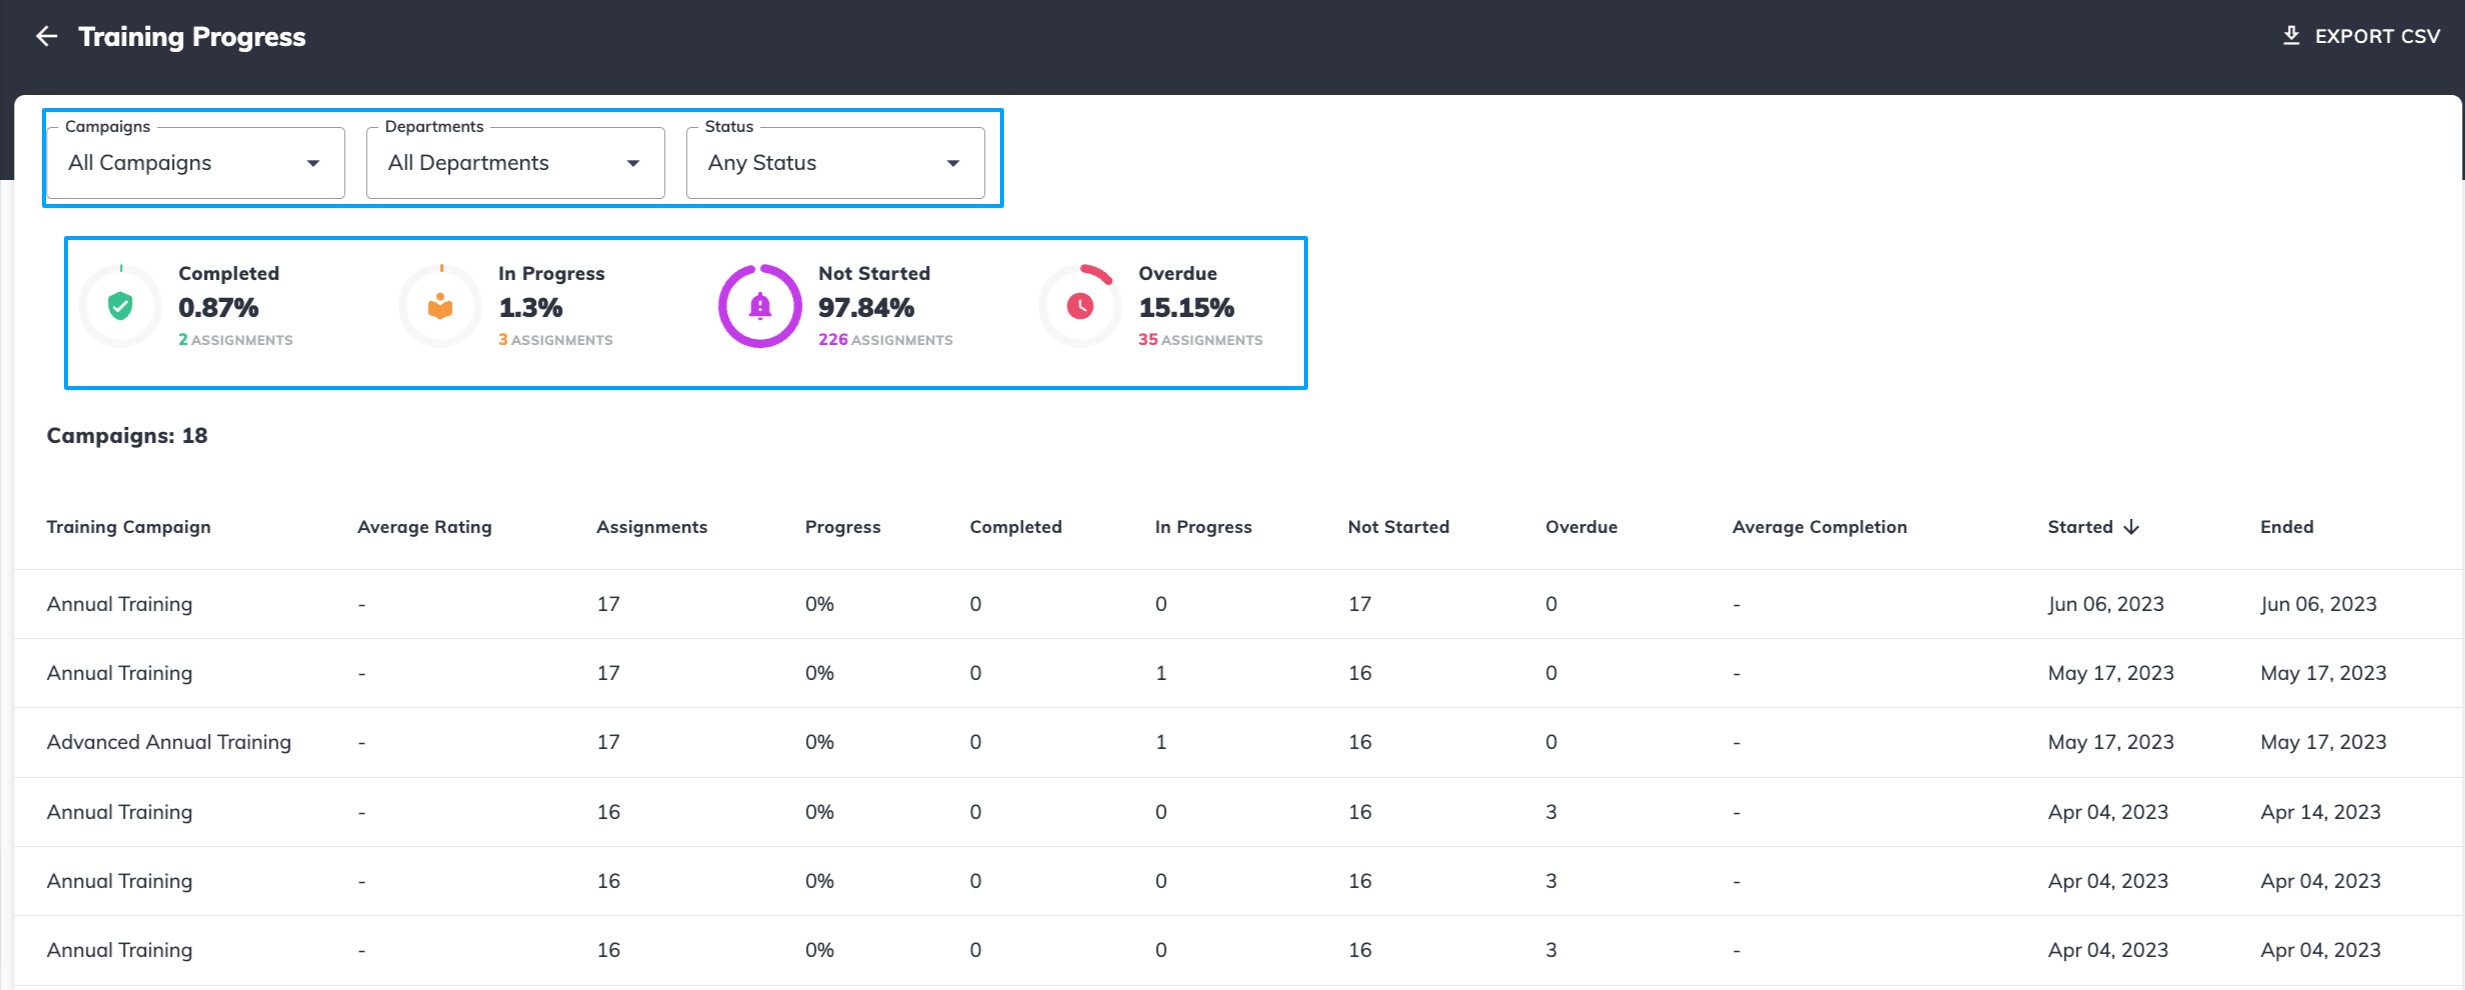
You can click on a specific training campaign row to see detailed statistics.
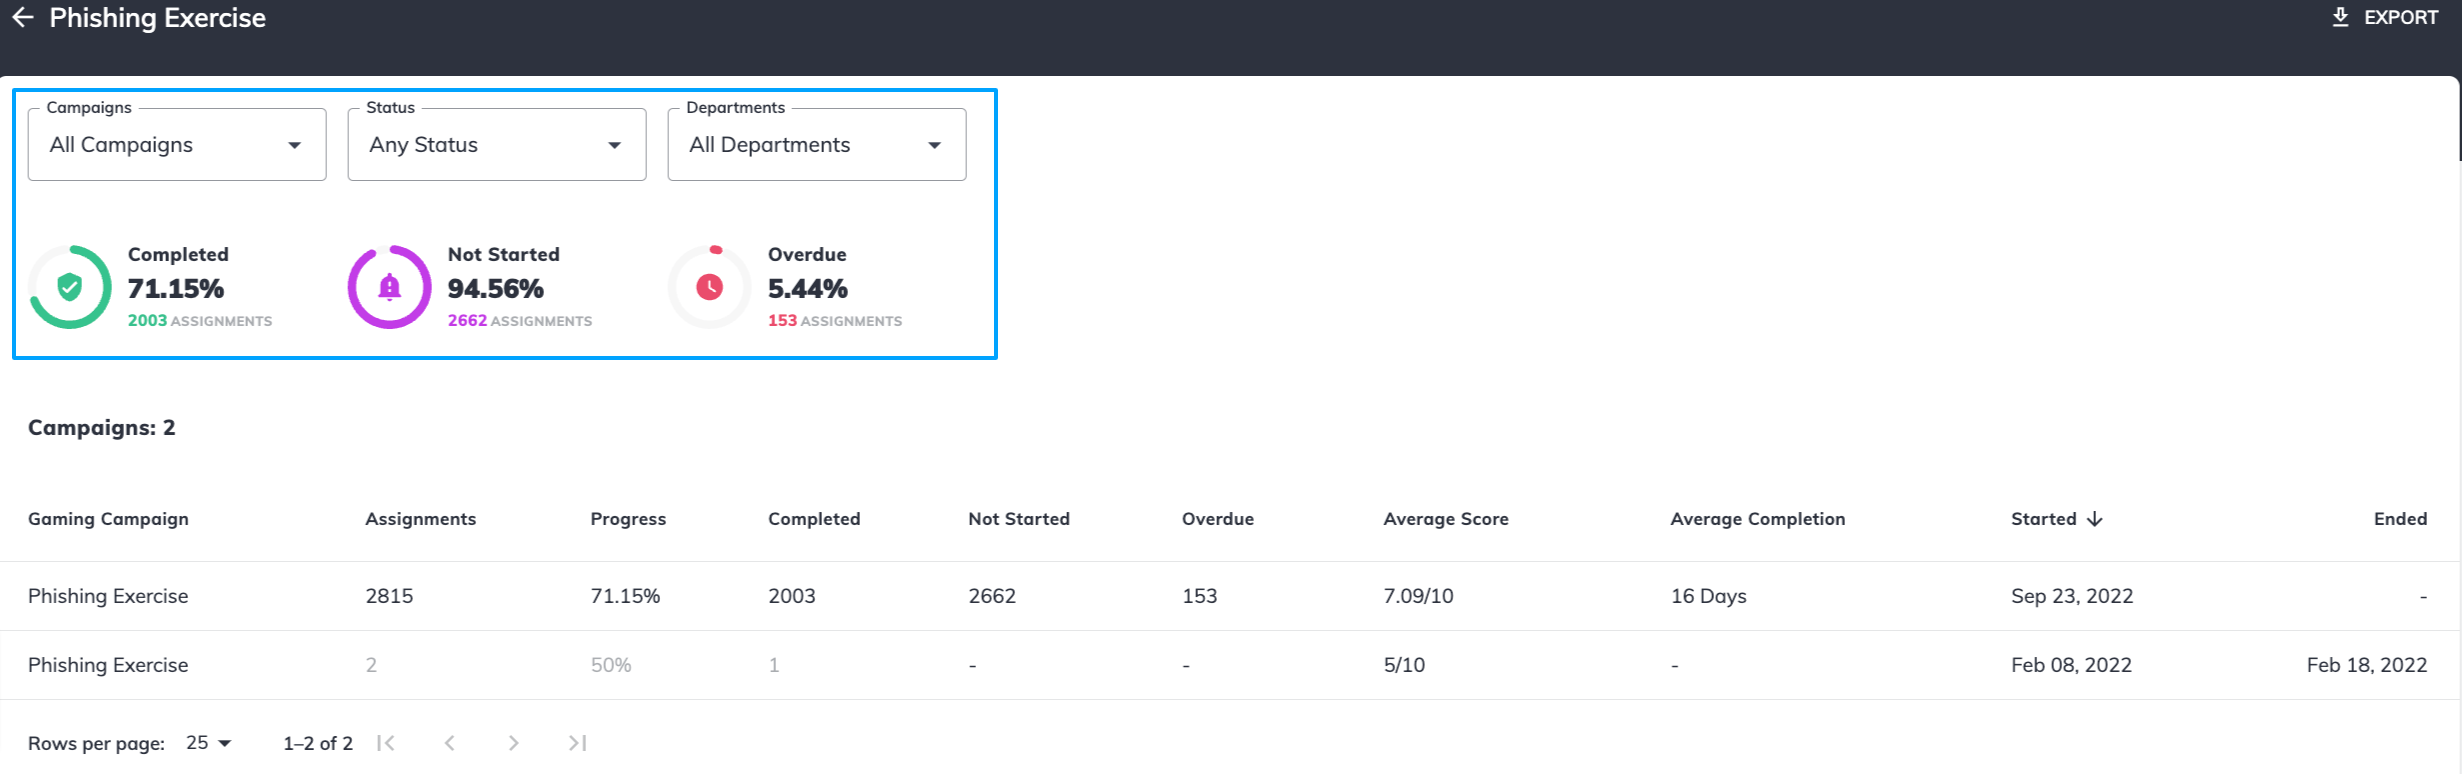
Phishing Exercise
The Phishing Exercise tab provides analytics on the exercises that were run on the account, the data can be filtered by specific campaigns, task status, and departments that had the task assigned.
Monthly Video Progress
The monthly video progress tab provides the data for monthly videos, the statistics can be filtered by certain month, status, and department.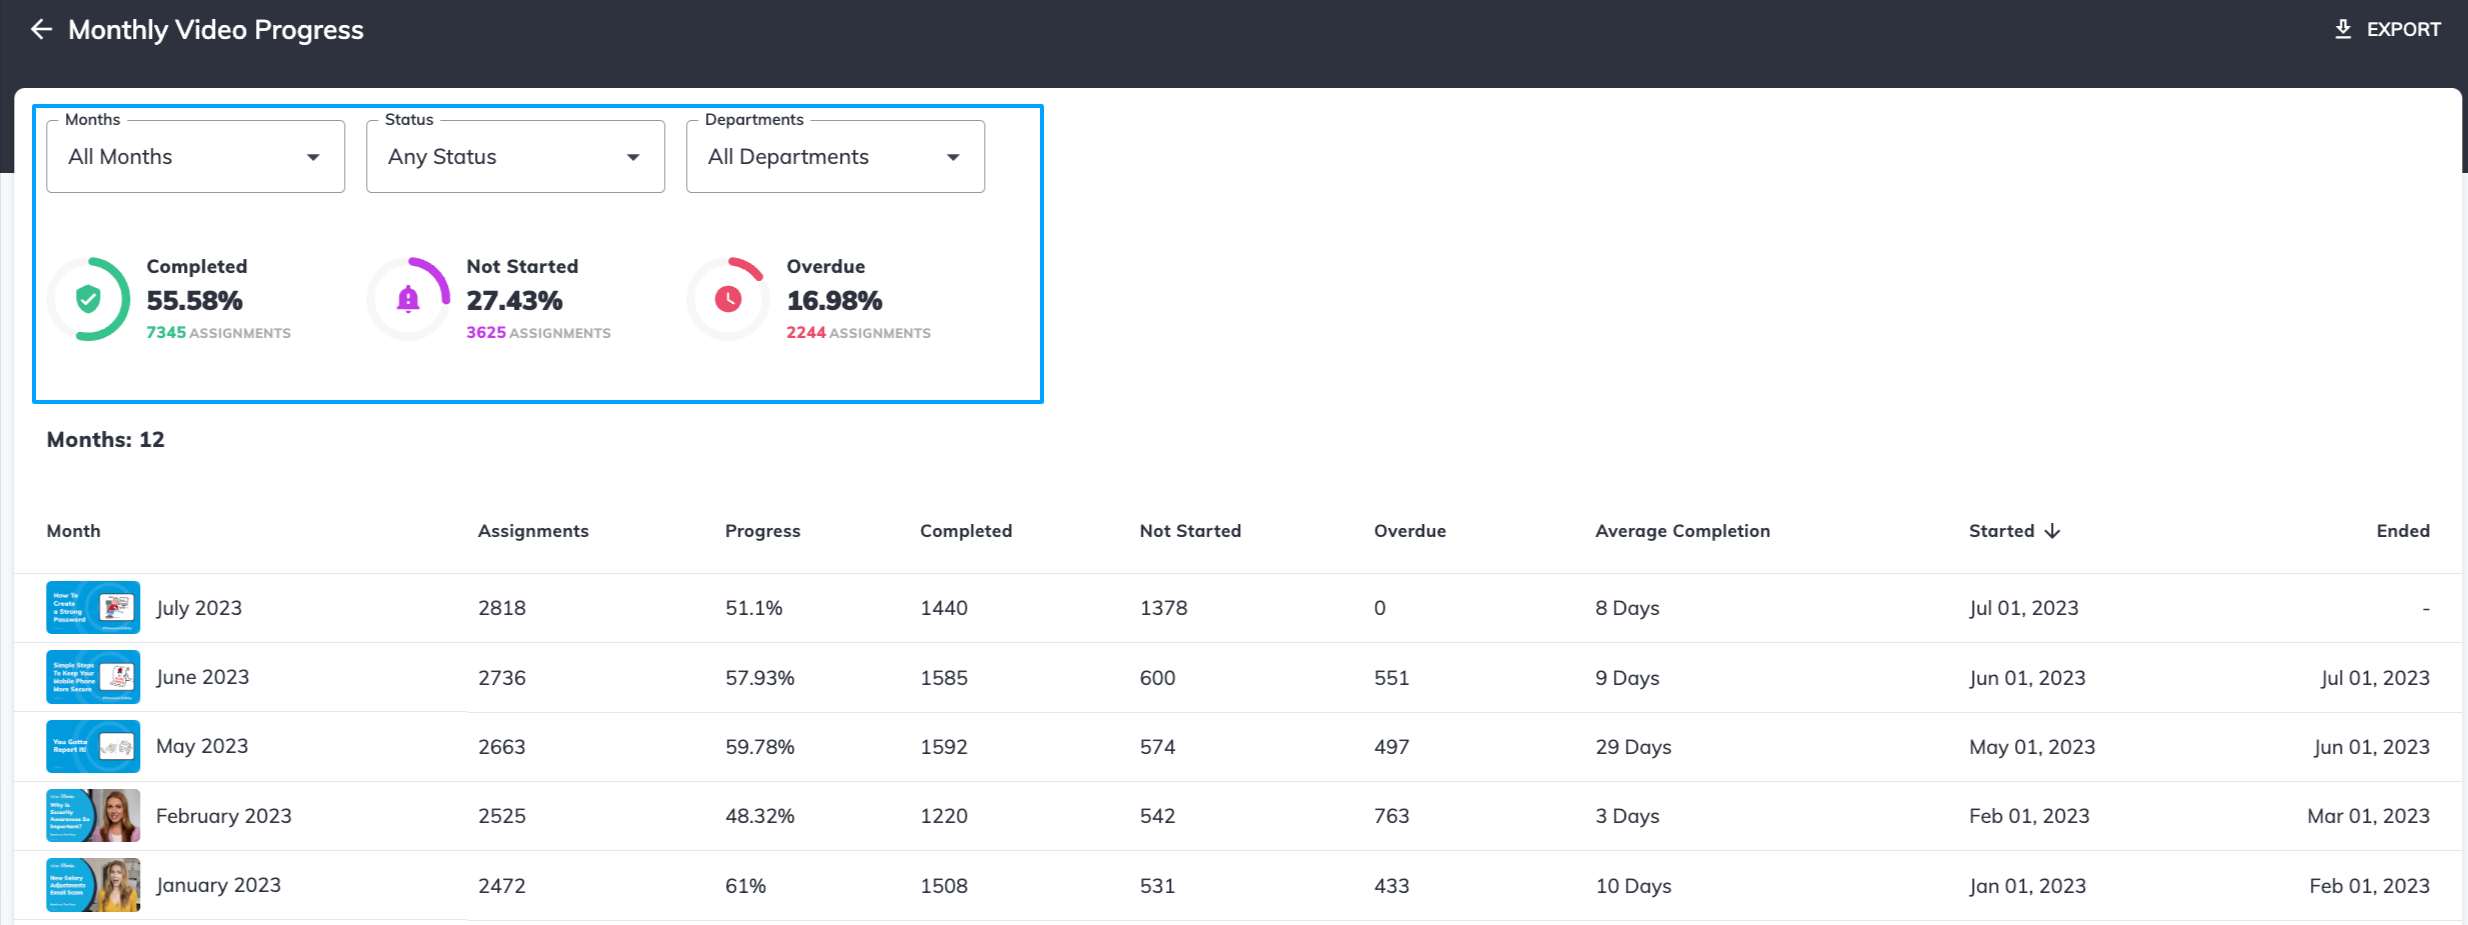
You can also preview the video by clicking on the thumbnail.
Quizzes
The quizzes tab provides analytics for quizzes run during the training.
Data can be sorted by period, training, and department.
Available filters are data by users: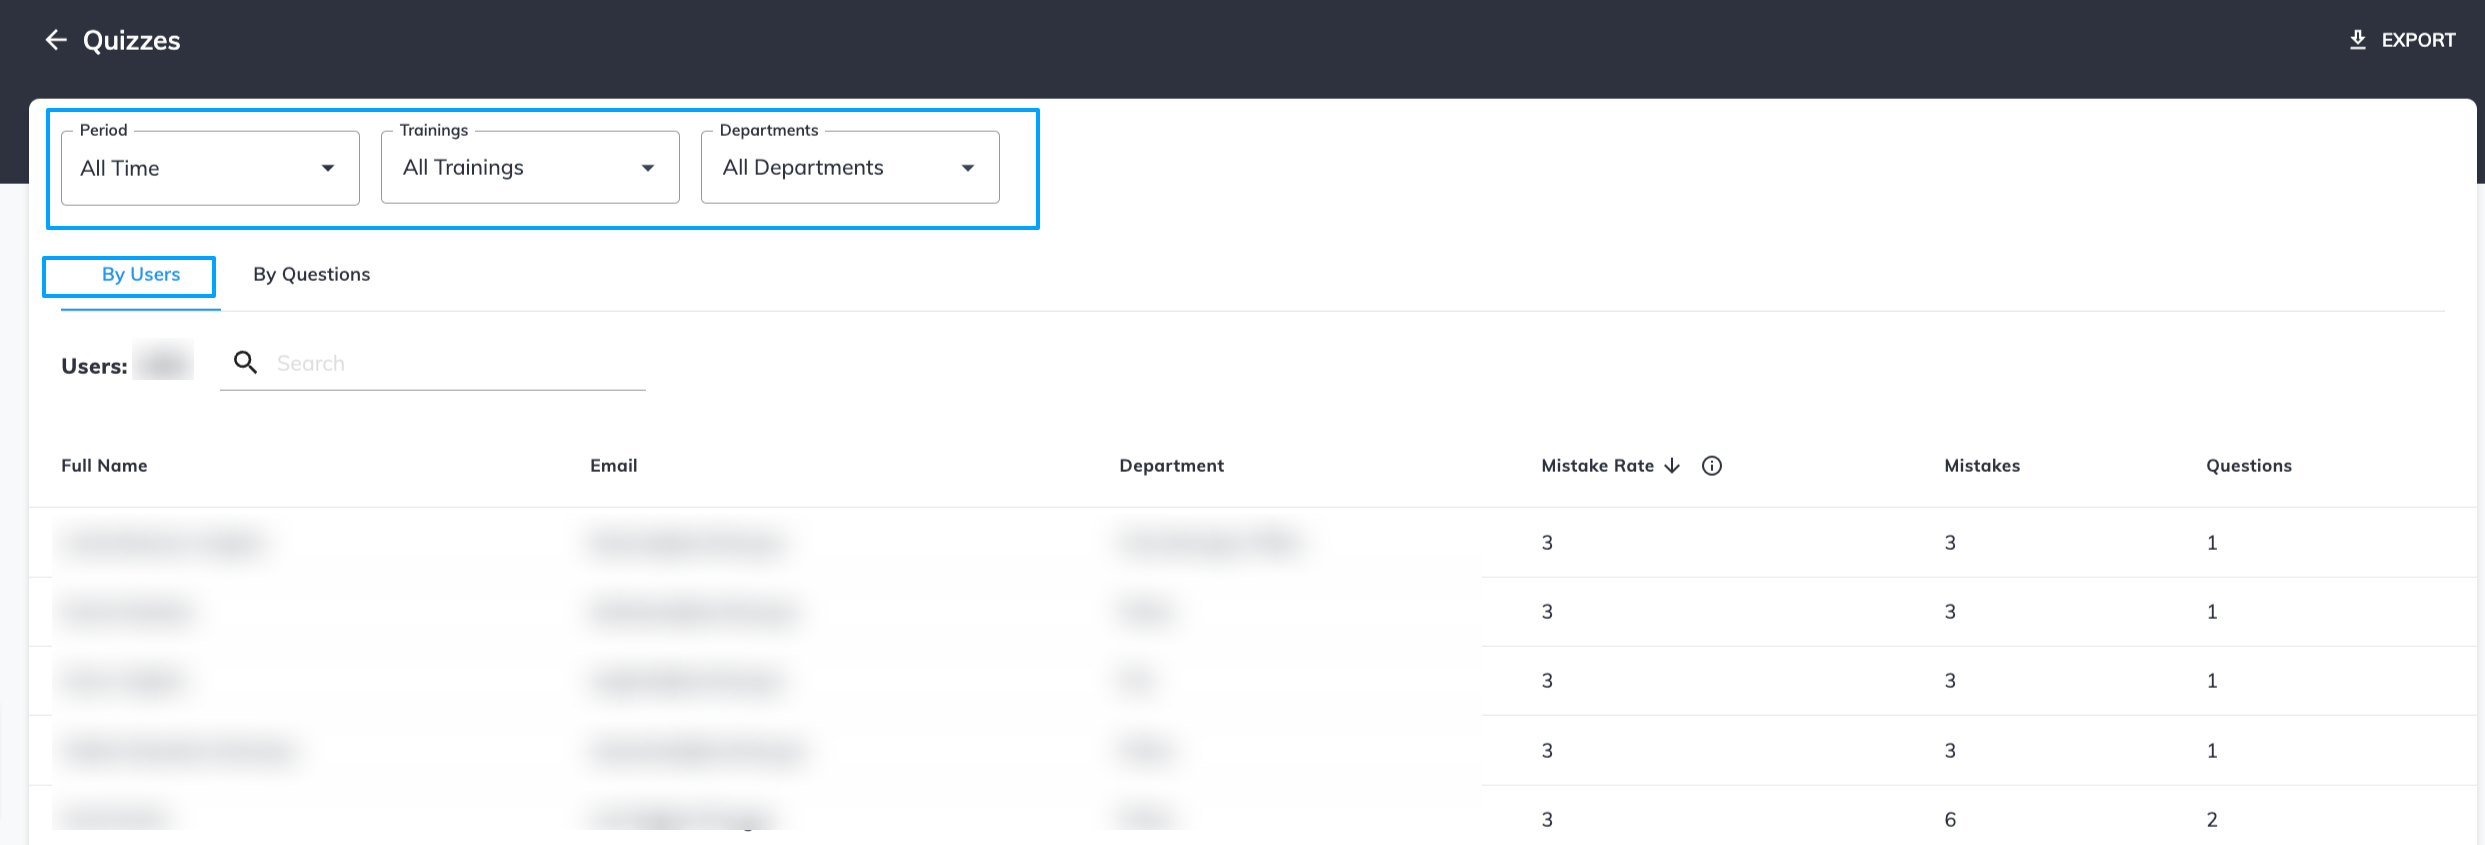
and data by questions:
- Mistakes stand for the overall number of mistakes (can be up to 3 mistakes per quiz question).
- Users Mistaken stands for the overall number of users who made one or more mistakes.
- Total Users is the total number of users who participated (unrelated to mistakes made)
Policies
The policies tab shows the analytics on the policy progress.
Data can be filtered by specific policy, status, and department.
Phishing Overview
The phishing overview tab provides insights into the phishing campaigns that were run on the account. Data can be filtered by period, specific phishing events, specific phishing campaigns, departments, and/or groups that the campaigns were run for.
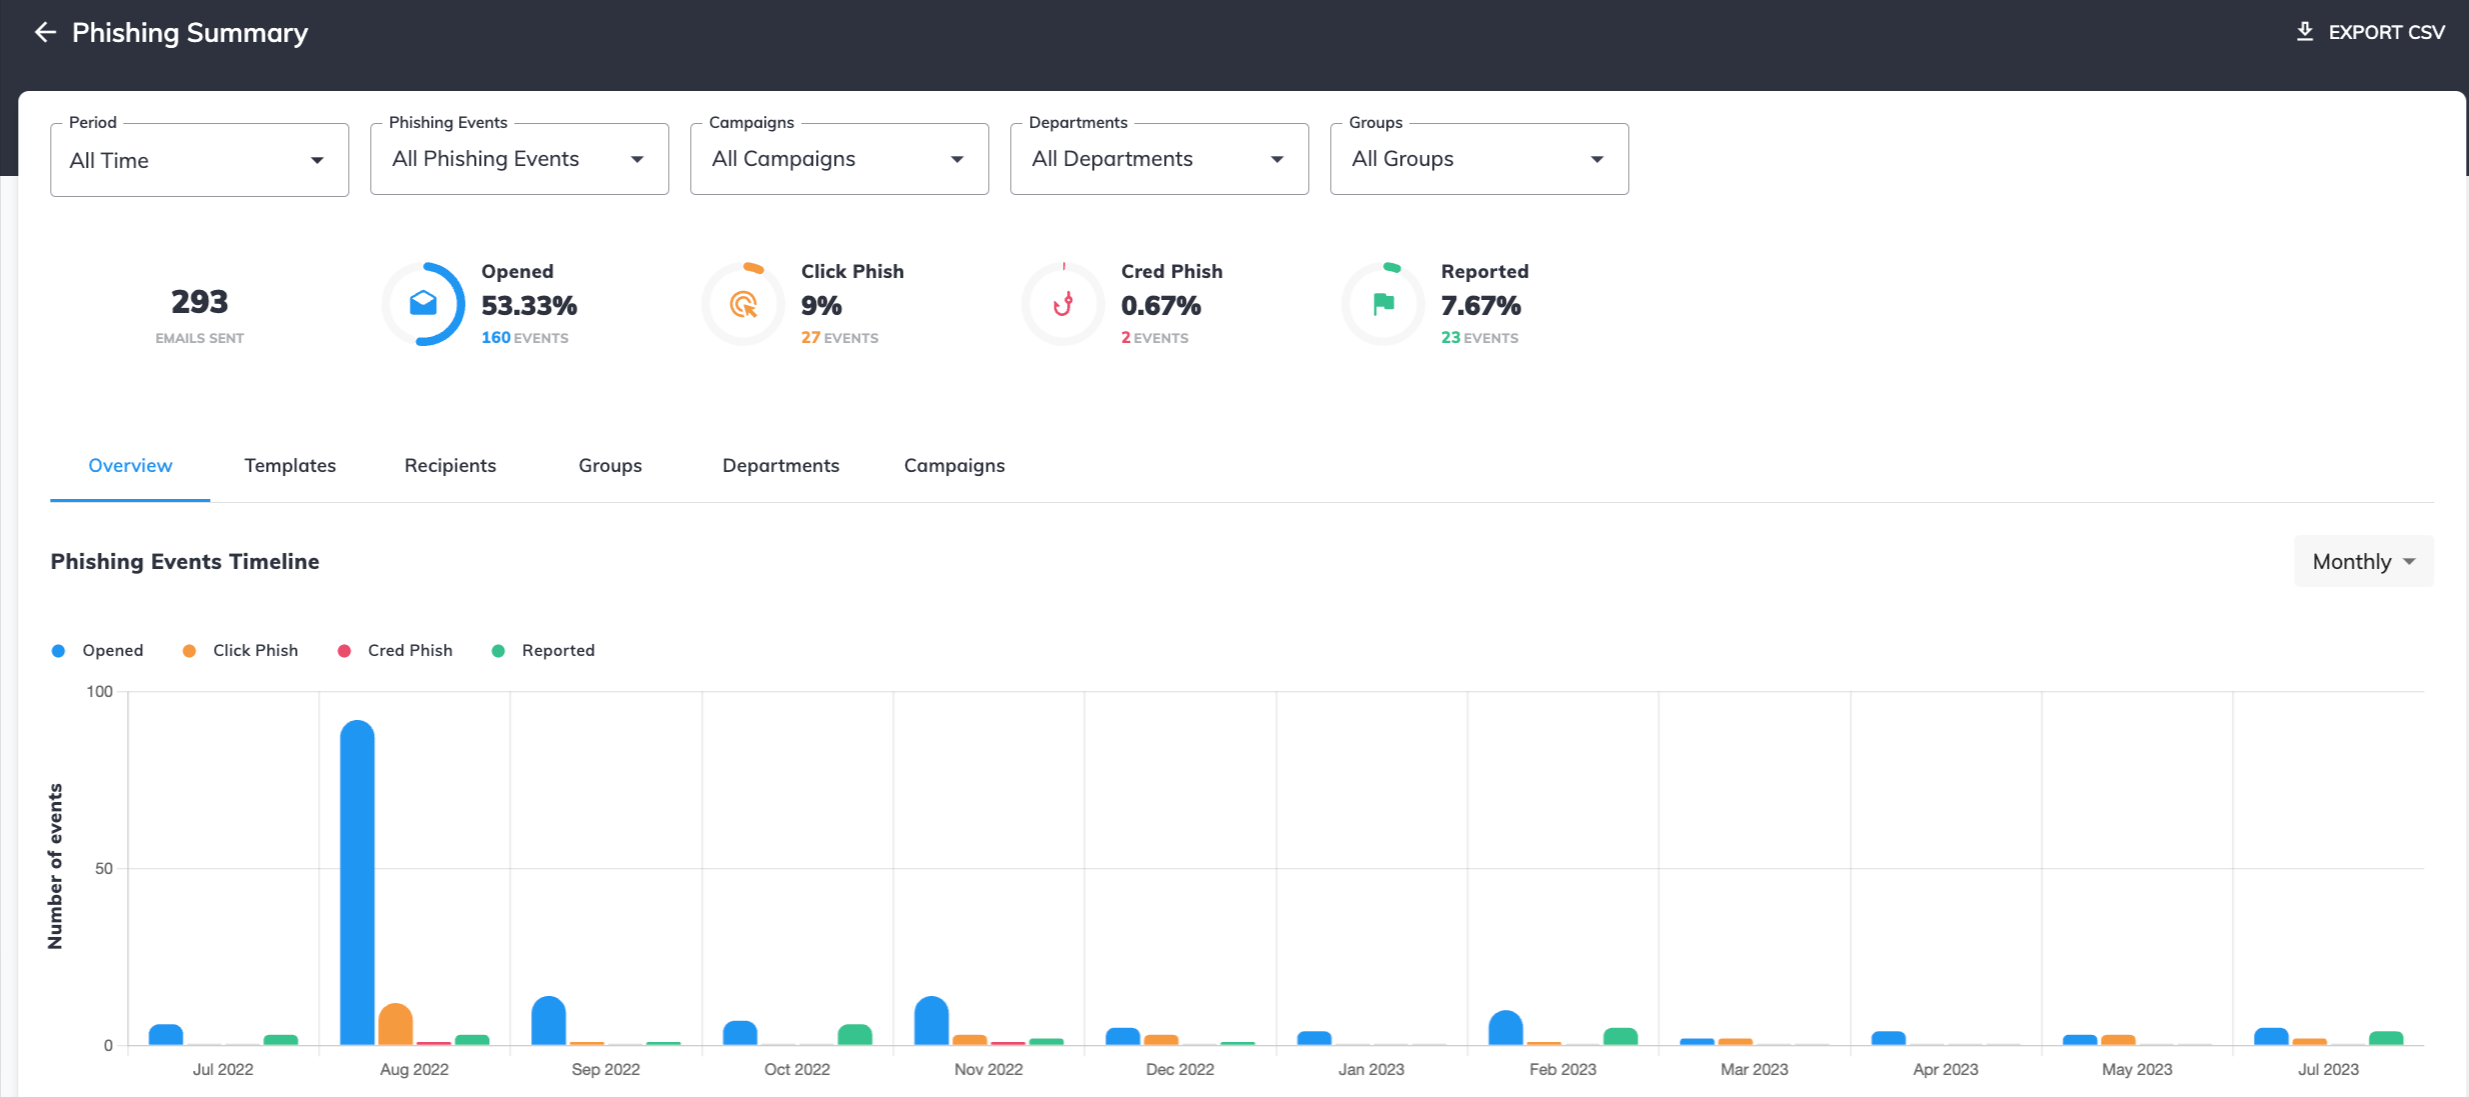
You can also see the timeline graph that visualizes the event numbers. You can also review the stats per template, recipients, groups, departments, and campaigns.
Phishing templates
The phishing templates tab provides data for the templates used in the simulations that were run on your account.
You can filter out specific periods, events, campaigns, departments, or groups for which the campaigns were targeted for.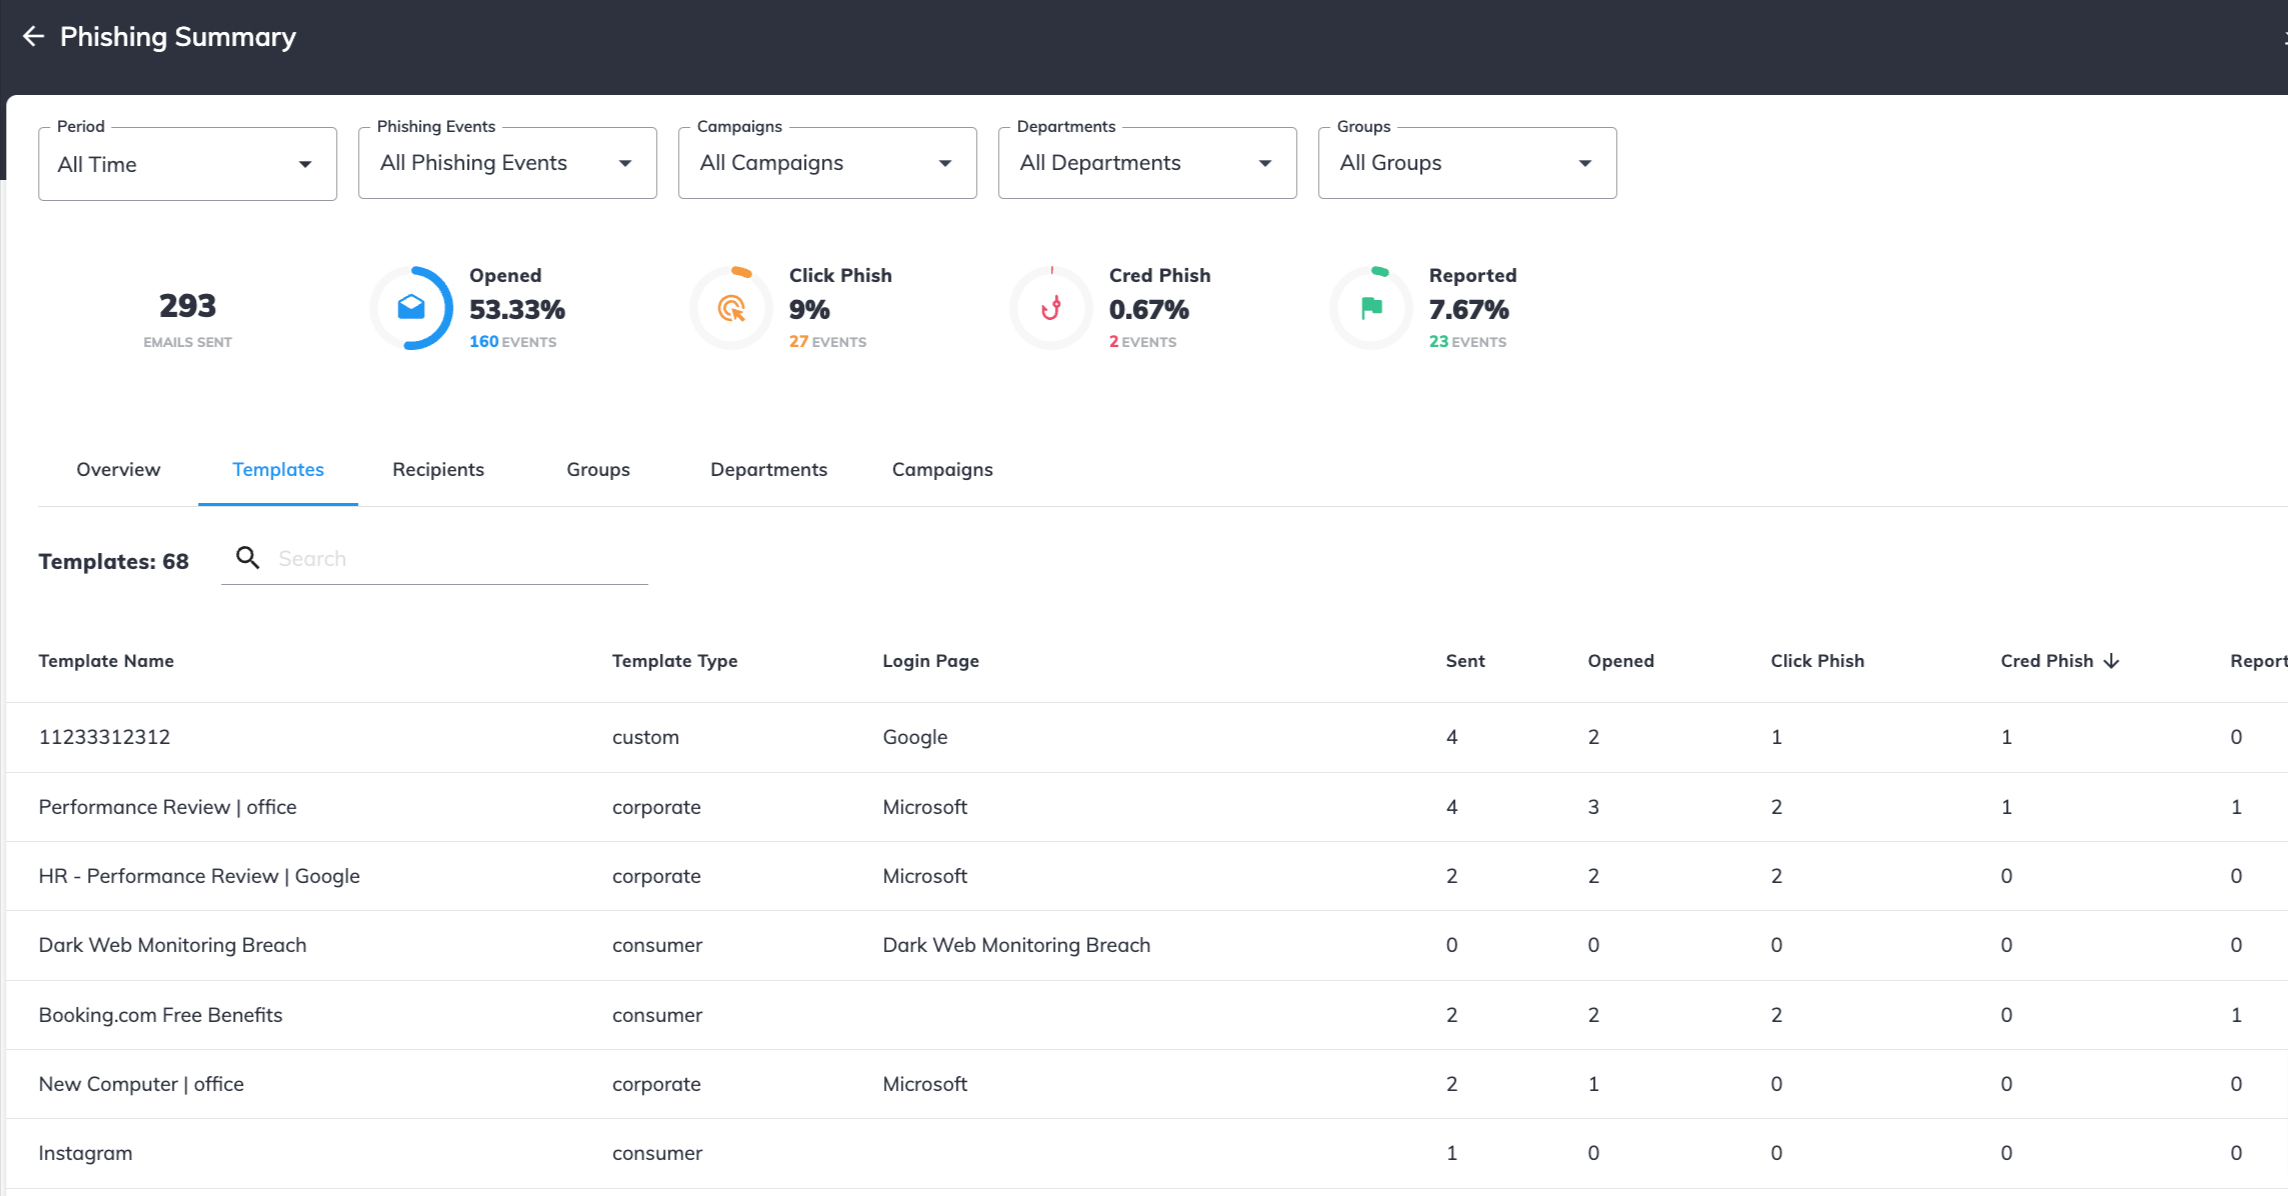
Recipients
The Recipients tab features the user statistics for the phishing simulation showing the overall number of phishing events per user/recipient of the simulation email.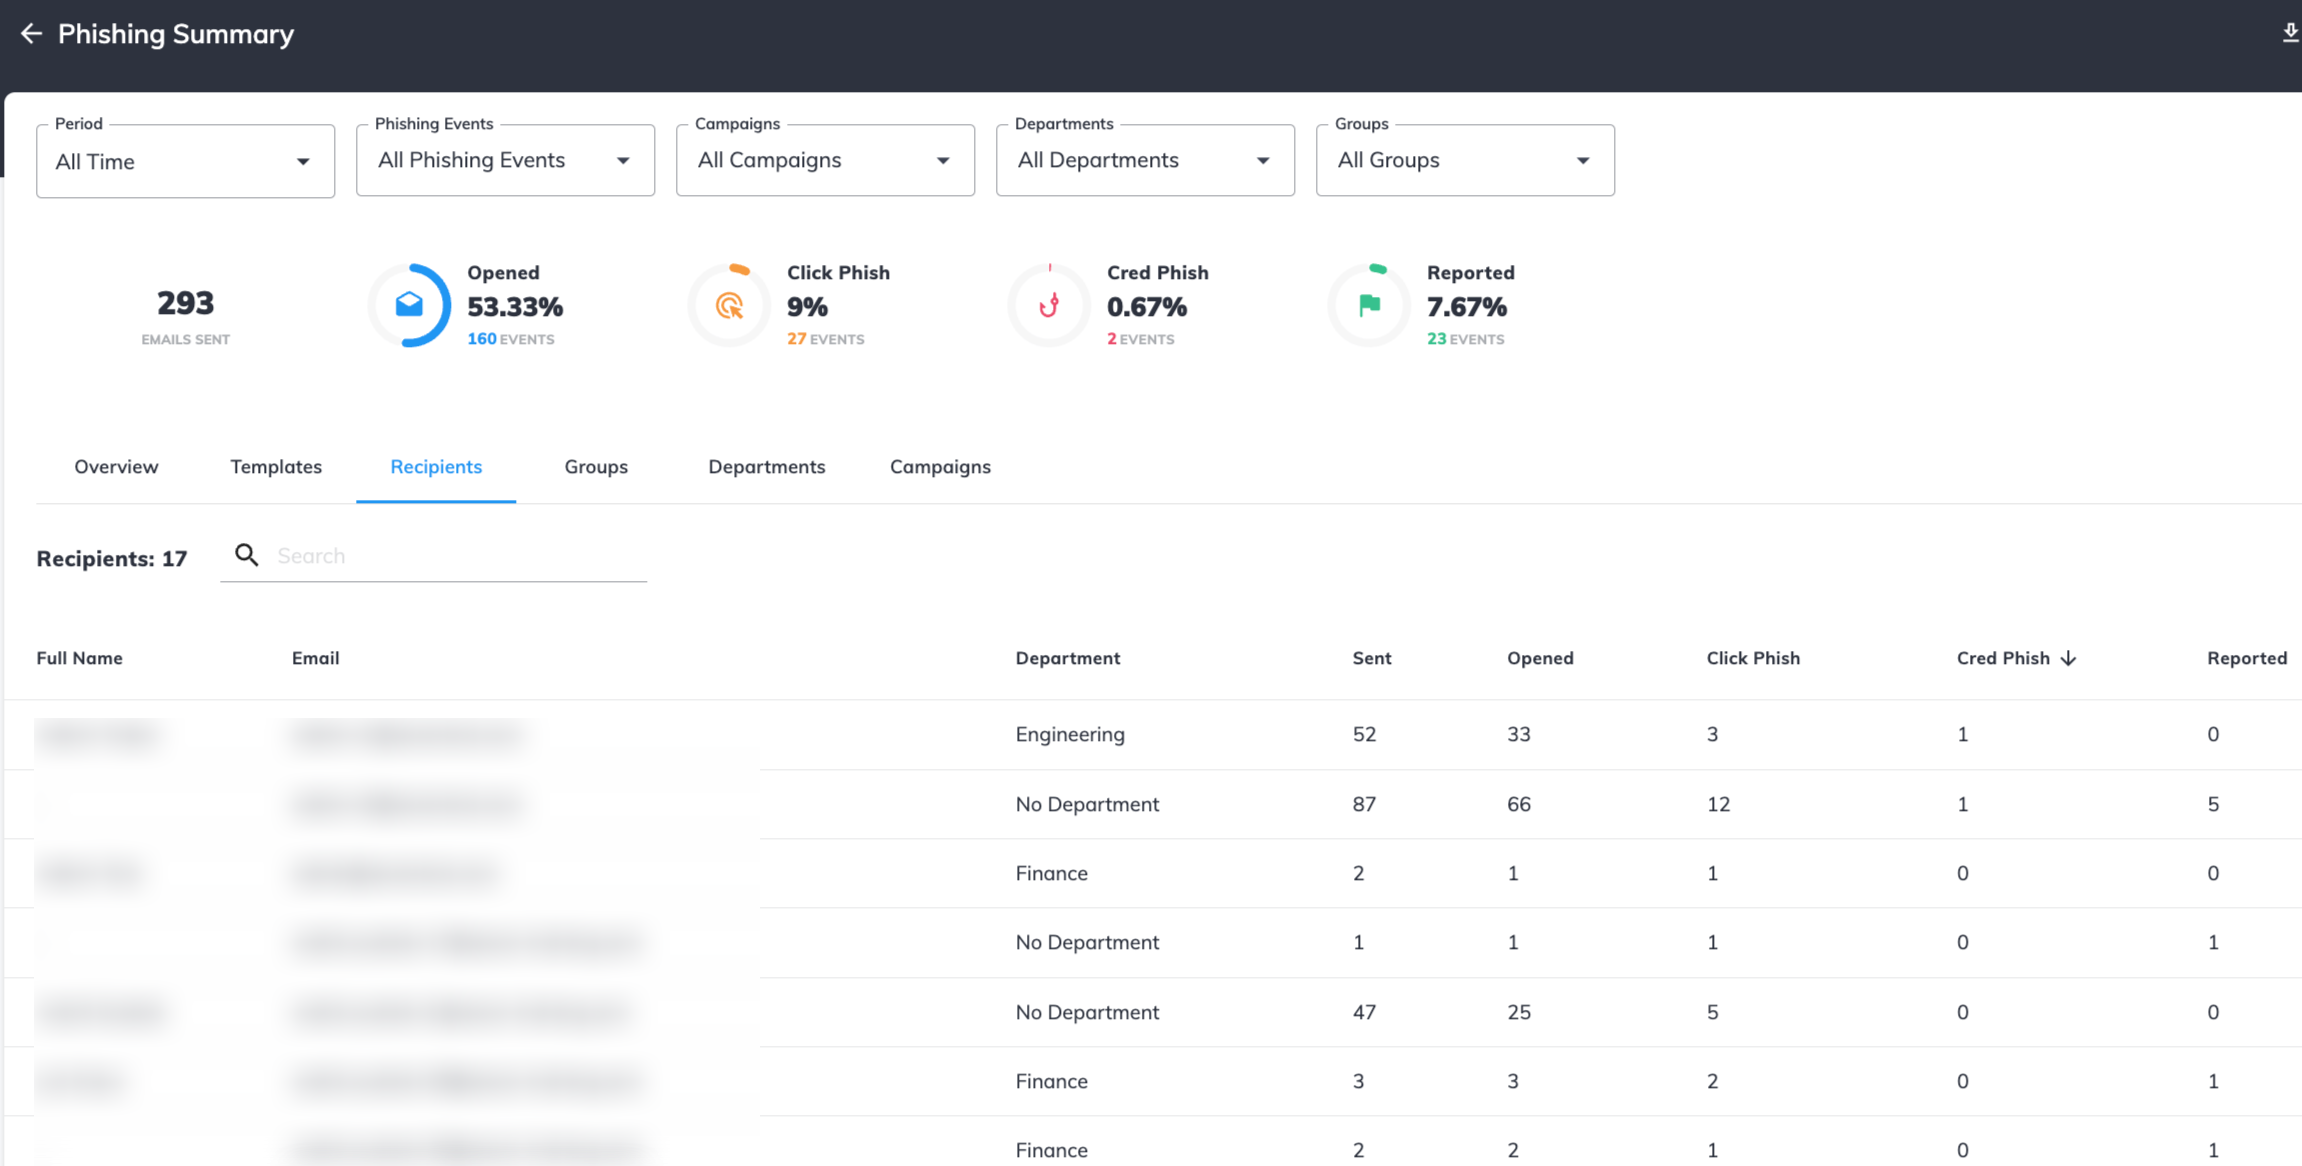
Groups
The Groups tab shows statistics for phishing simulation filtered by groups that are on your account.
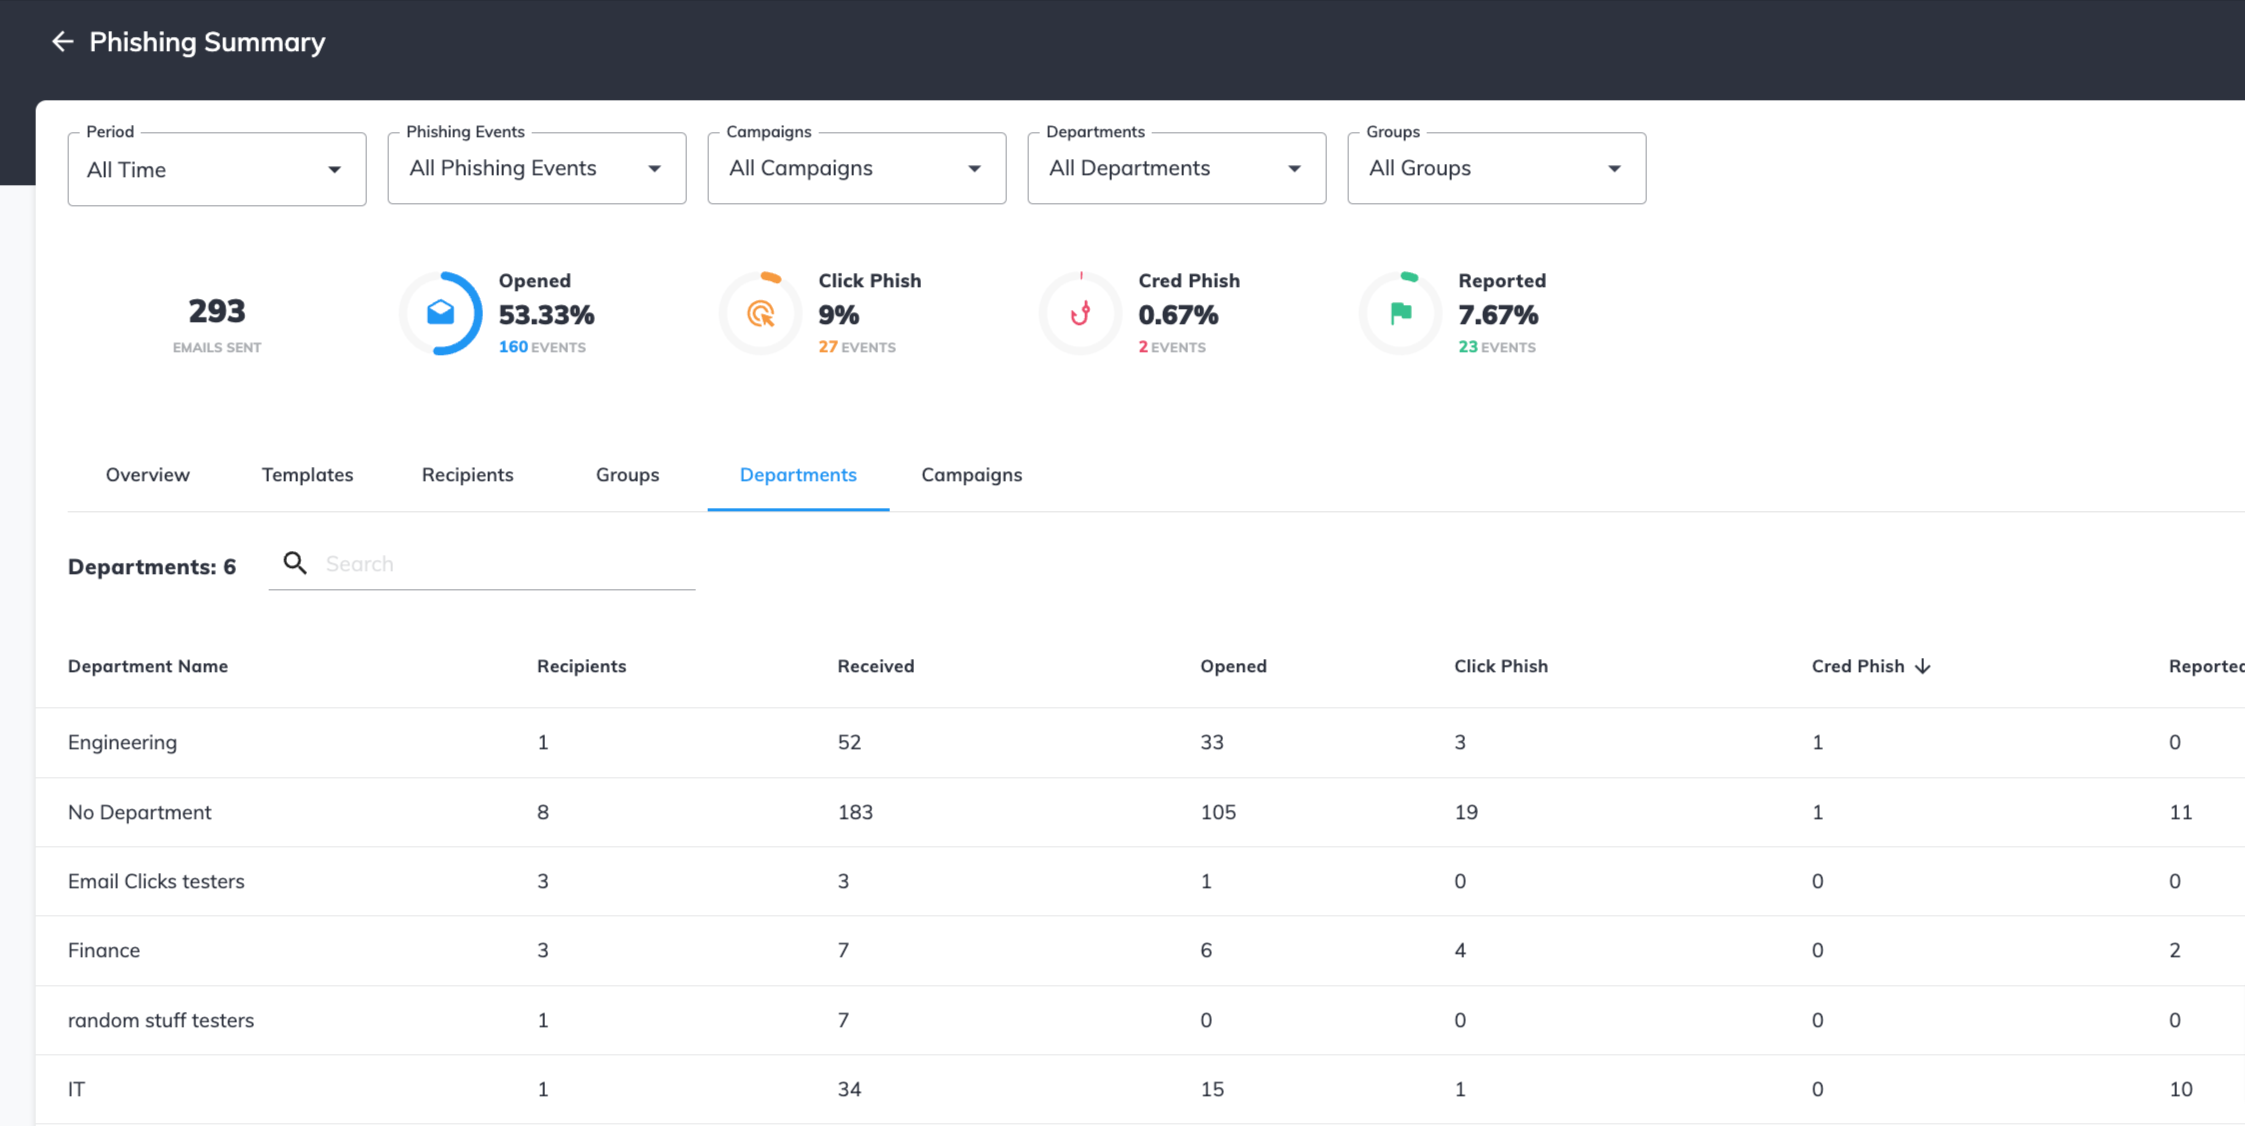
Departments
The department tab provides data on the phishing simulation emails received and filtered by departments on your account.
Phishing Campaigns
The phishing campaign summary provides analytics on the Phishing simulation campaigns.
Data can be filtered by specific periods, phishing events, specific phishing campaigns, and departments that the simulation was run for.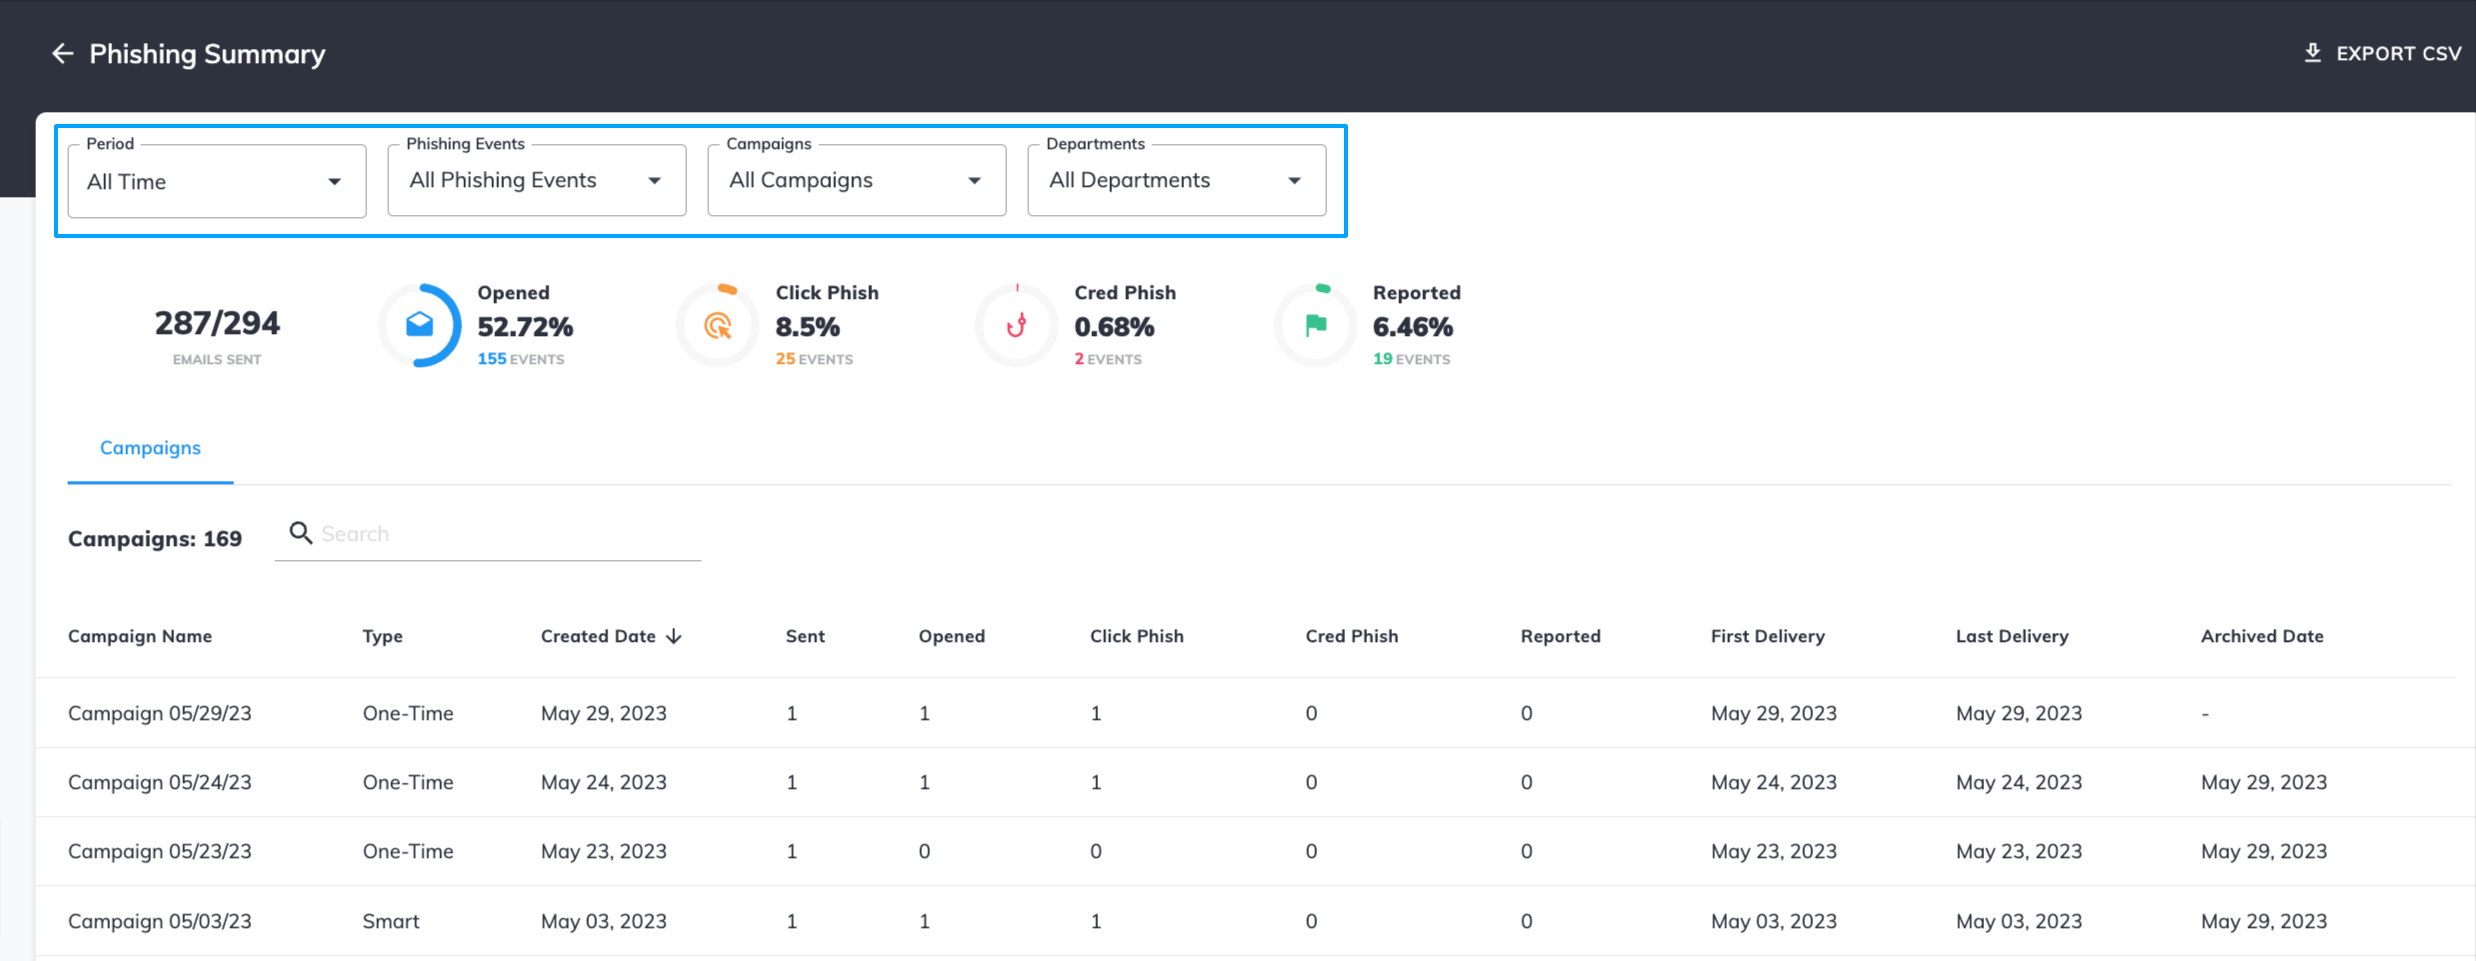
You can click on a specific simulation campaign row to see detailed statistics about it, by pressing on Open Report.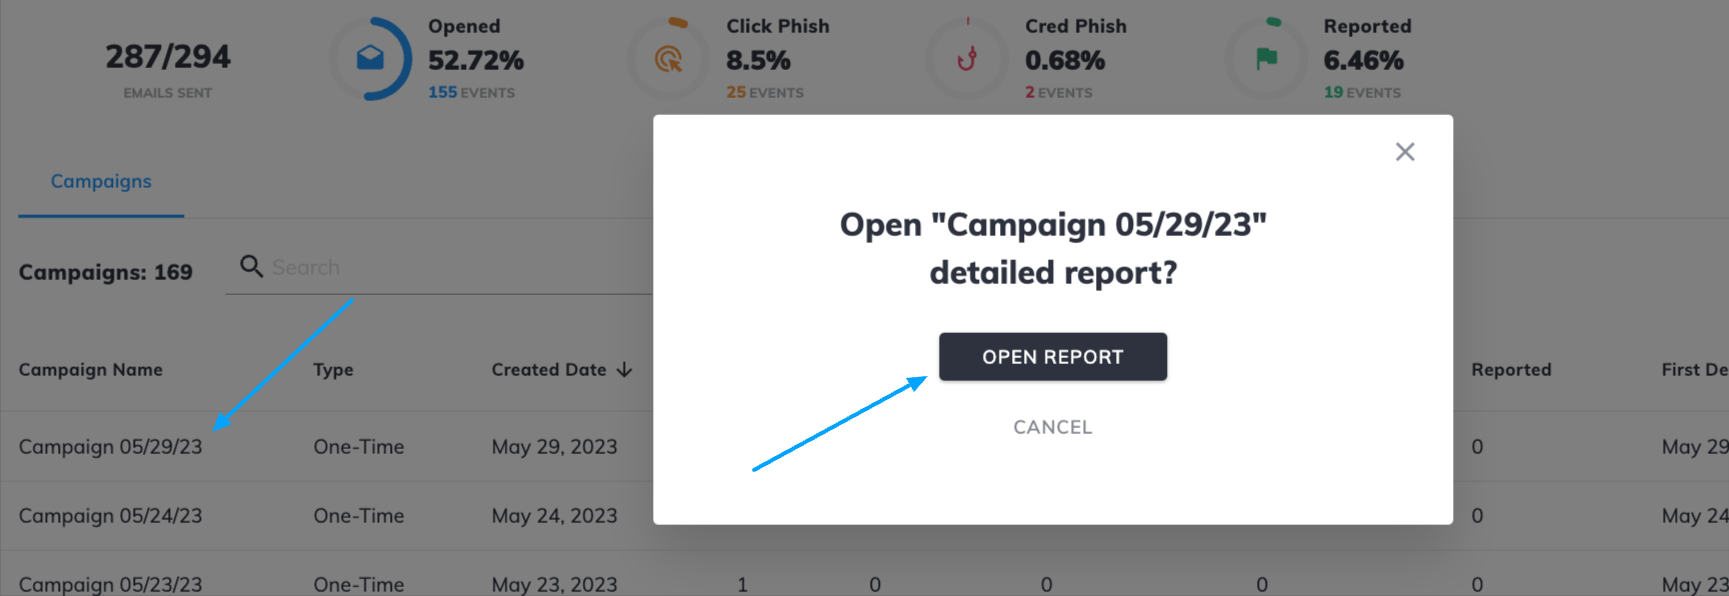
The report will include statistics of all users who took part in the campaign.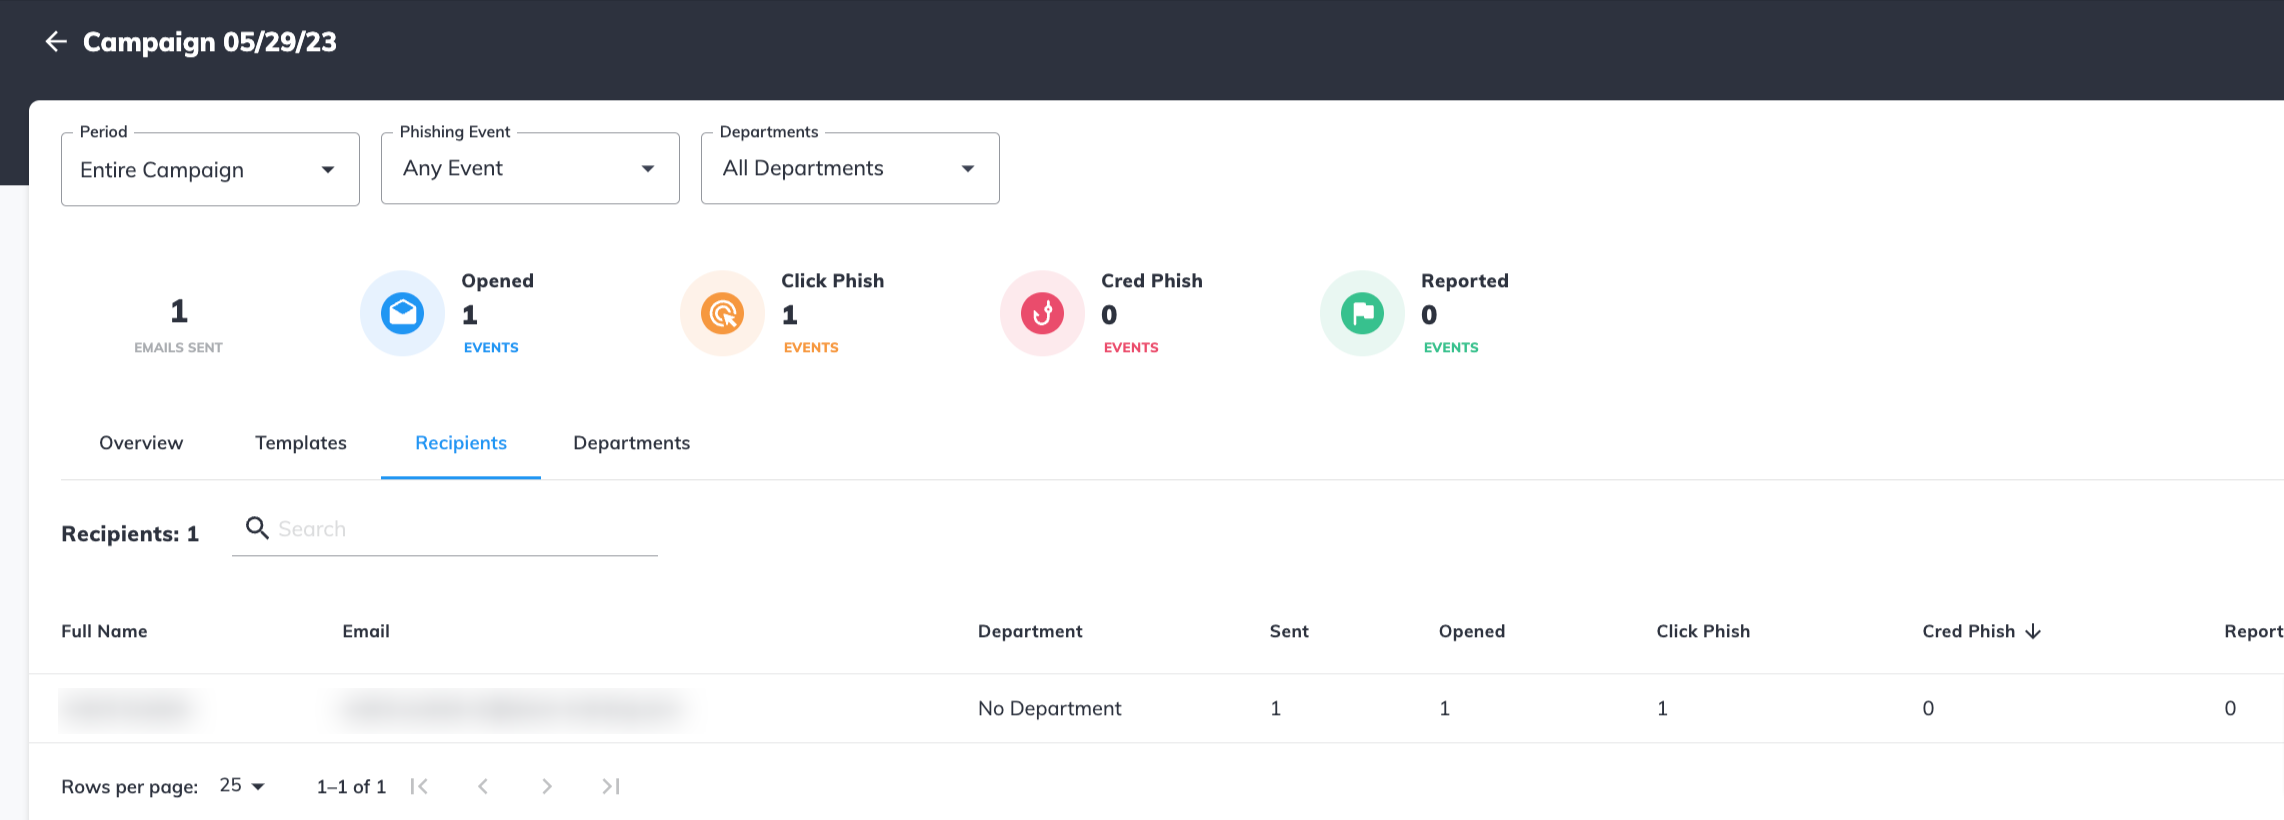
For both tabs, the reports are downloaded in CSV format.
Any questions? Please contact our support specialists at support@wizer-training.com.