Get Started Analytic Page Explanation
This article is an overview of the get started analytics page
Once the company account is freshly created, you will see the following:

The above features an option to launch the first training, alongside the short get started video.
By pressing the Start Training, the Annual Training level 1 will be launched for ALL users in your company.
In case you already had a training launched previously only, you will see the following:
Since the Company Culture score is dependent on multiple values you might not see the percentage if no sufficient amount of data is available at the moment.
Once you enable the activities for data aggregation you can see the statistics:
The Company Security Culture level is a combination of enabled activities:
Phishing Exercise, Training, and Phishing Simulation.
The values below contribute to the maximum Company Culture value of 100%:
Training provides 60%
Phishing exercise provides 20%
Phishing simulation provides 20%
Per the above conditions in case you decide not to use the Phishing Exercise or Phishing Simulation the maximum Company Culture value you get is 80% 
The Company Culture status has 5 variations:
Vulnerable, Basic, Improved, Advanced, and Excellent statuses can be shown and will differ the higher the overall percentage is.
What is previous and now? Both are considered timeframes
Now: This stat is generated every 1st day of the month and will include newly launched training (after the 'Now' stat is generated), and will also include continued training campaigns from the previous month(s) (which are still in progress until you end them). Thus, this stat shows the results for the current month.
Previous: Will include every training that was launched before the moment the 'Now/Current month' stat was generated and will include training campaigns that have ended during the previous month(s) alongside the still active training campaigns(which are also moved towards the 'Now/Current month' stat.)
Training completion
The training completion section features the analytics for the user completion of the currently running training.
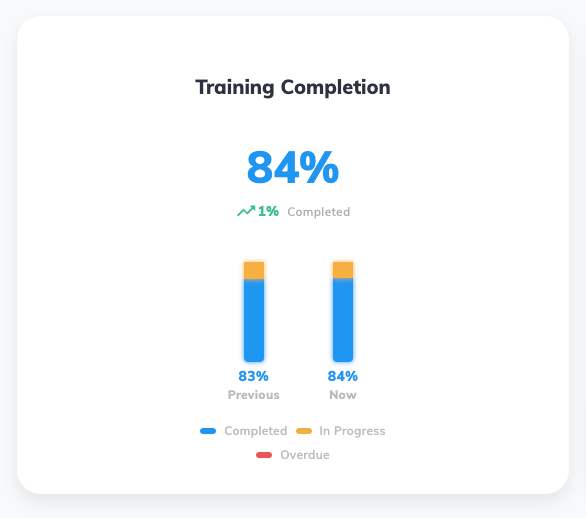
As for the values:
Completed - shows the percentage of users who completed the training task
In Progress - shows the percentage of users who are in the process of completing the training task
Overdue - shows the percentage of users whose training tasks are overdue
You can also see the completion change tendency with increasing value or decreasing values.
Hovering over the graph will show more details like the number of assigned users: 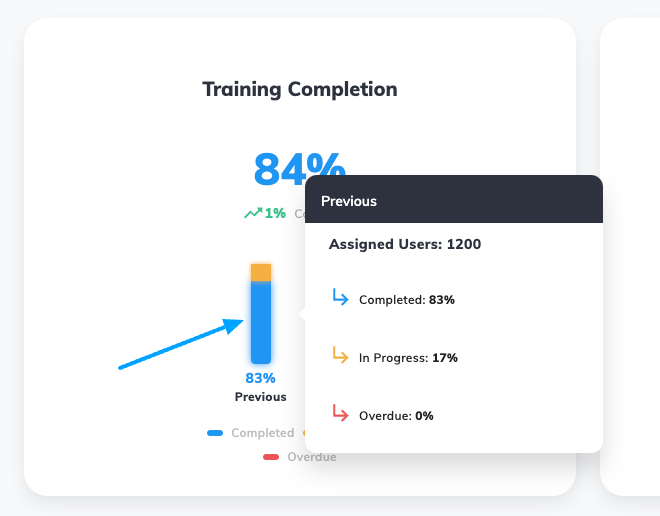
Phishing exercise score
The phishing exercise score features the statistics for completing it, whereby hovering over it you can see the number of assigned users, "Your score" which stands for the average score for your company, and "Industry score" which stands for the average score among Wizer customers.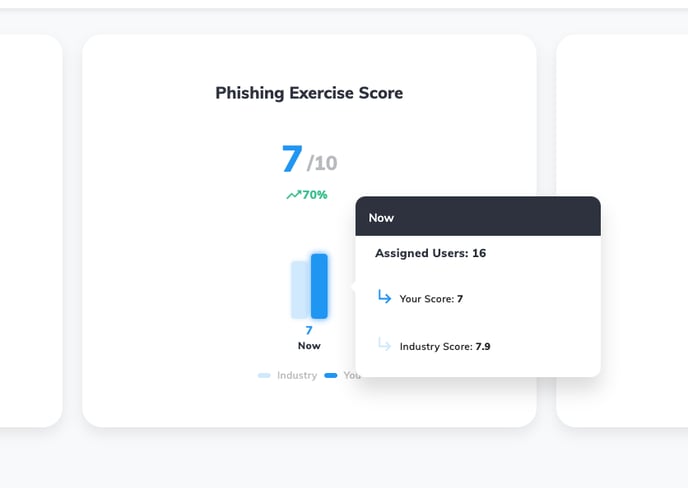
Phishing Simulation
The phishing simulation section shows the result percentage for phishing simulations that ran for your company.
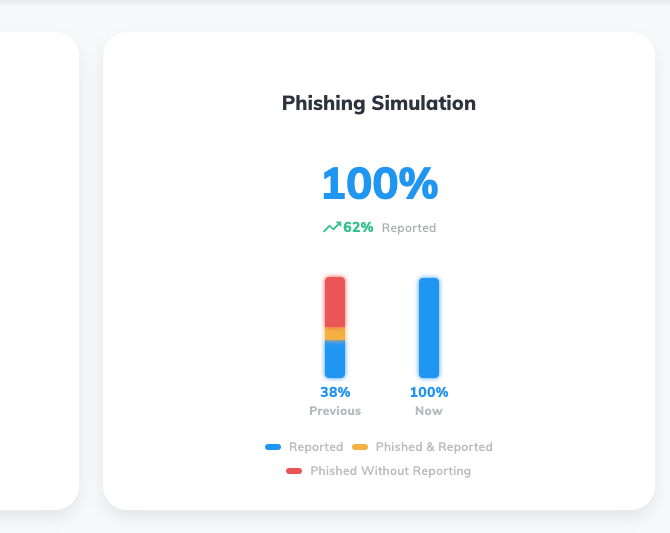
By hovering over you can see the percentage divided per phishing event (sent and opened events excluded):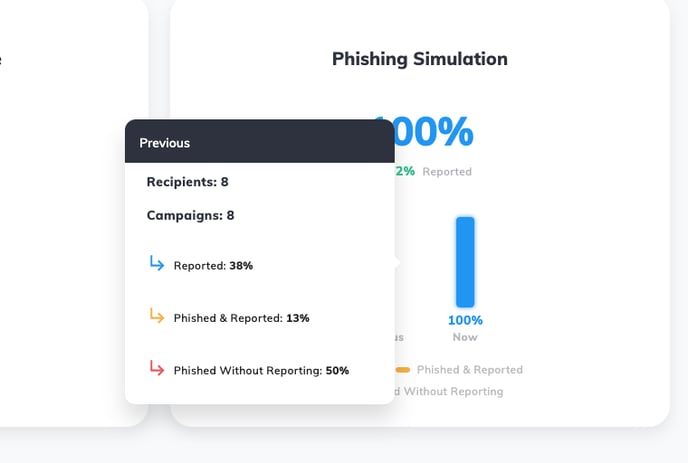
Where:
Reported is the percentage of users who reported the simulation email
Phished & reported is the percentage of users who got phished and reported the simulation email
Phished Without reporting is the percentage of users who got phished but did not report the simulation email
Best regards,